

Most Malaysian SMEs treat every SKU as equally important, even though a handful of products usually bring in most of the money. ABC analysis for inventory fixes that. It ranks your SKUs by value so you can count, restock and protect the products that matter most, and spend less effort on the long tail.
Quick answer:
ABC analysis ranks your SKUs by annual sales value (units sold × price). A items are the few that drive most revenue, B items sit in the middle, and C items are the long tail. Count and restock A items most closely. 8Stock stock reports, exported to Excel, give you the data to rank them.
What is ABC analysis in inventory management?
ABC analysis is a method for sorting inventory into three classes based on how much value each SKU contributes. In other words, it answers one question: “If I can only watch some products closely, which ones should they be?”
The idea comes from the Pareto principle, often called the 80/20 rule: a small share of items tends to account for a large share of value. Treat that as a rule of thumb, not a target. Your own numbers decide where the lines fall, and they will differ for a Shopee fashion seller, an FMCG distributor and a hardware trader.
For a Malaysian SME, this matters because cash is usually the tightest resource. Every ringgit tied up in a slow SKU is a ringgit you cannot spend on a bestseller that is about to run out. Likewise, a stockout on an A item costs far more than a stockout on a C item. As a result, ABC analysis turns “stock everything just in case” into a clear order of priority.
How to do ABC analysis for inventory in Malaysia: 5 steps
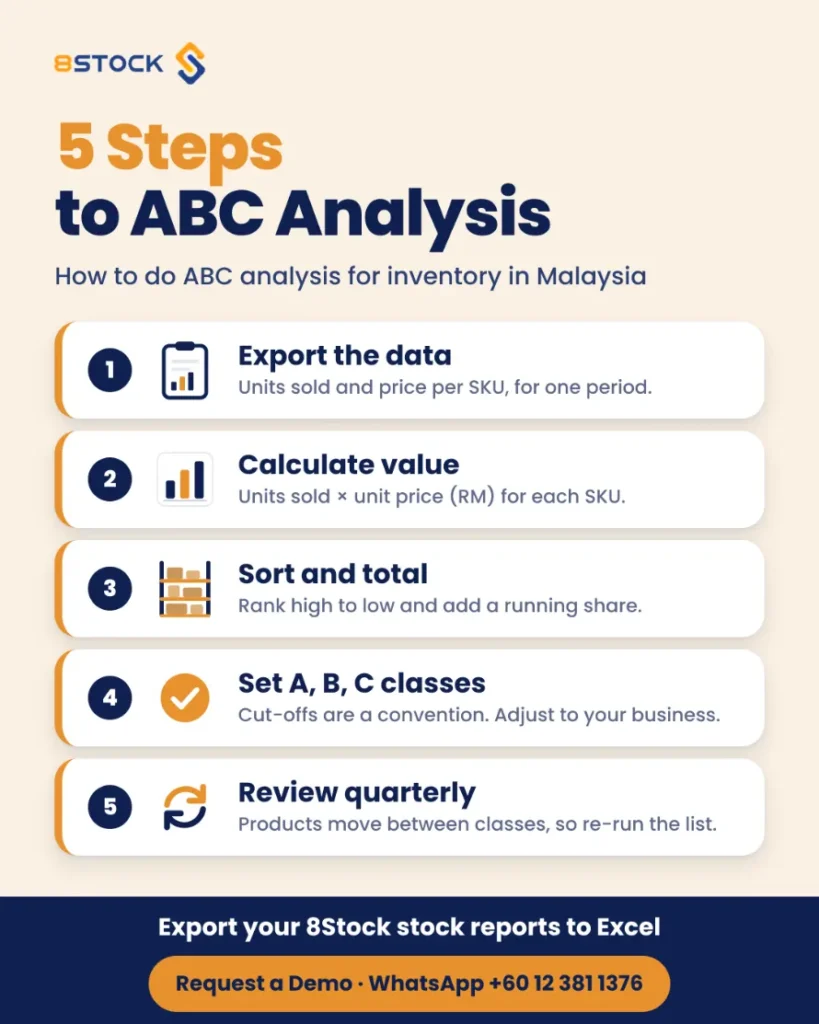
You do not need special software to start. A spreadsheet is enough.
- Export the data for one period. For each SKU, collect units sold and selling price (or cost) for the same period, such as the last 3 or 12 months. Sales data can come from your Shopee and Lazada order exports or your accounting software. Stock quantities can come from your stock reports.
- Calculate value per SKU. Units sold × unit price (MYR). Ranking by units alone is misleading, because 1,000 cables at RM8 may matter less than 300 earbuds at RM80.
- Sort from highest to lowest and add a cumulative share. Add each SKU’s value to the running total and divide by total value. This shows how quickly the top SKUs add up.
- Set your A, B and C cut-offs. A common starting point is A for the SKUs that make up roughly the first 80% of value, B for the next 15% and C for the last 5%. These are a convention, not a standard. Adjust them to your business.
- Review every quarter. Products move between classes as seasons, campaigns and prices change. Re-run the list on a regular schedule so the classes stay accurate.
What to do differently with A, B and C items
The point of the classes is to change how you manage each group. The table below is a starting framework.
| Class | What it usually looks like | Count frequency | Reorder attention | Example action |
|---|---|---|---|---|
| A | Few SKUs, most of your sales value | Most often, such as monthly cycle counts | Closest: review often, keep a safety buffer | Check stock before every mega-sale and replenish first |
| B | A moderate number of SKUs, moderate value | Regularly, such as quarterly | Routine: standard reorder rules | Review each quarter for promotion to A or demotion to C |
| C | Many SKUs, small share of value | Least often, such as at the yearly stock take | Light: order in simple, larger batches | Question whether every C item needs its own shelf space |
Two cautions apply. First, “C” does not mean “delete”. Some low-value items are needed to complete an order or to keep a customer, so decide case by case. Second, class is about value, not volume, so a low-priced, fast-moving item can still be a B or C item.
Once you know your A items, see the pros and cons of inventory management for the bigger picture, then track the KPIs that protect them. Our guide to 6 warehouse KPIs a Malaysian SME should track covers stockout rate and inventory turnover, and our piece on SKU management in Malaysia helps you keep SKU codes and units clean before you rank them.
Worked example (illustrative numbers only)
Below is a made-up seller of phone accessories, ranked by quarterly sales value. These figures are illustrative. They are not 8Stock data or an industry benchmark.
| Rank | SKU | Units sold | Price (RM) | Value (RM) | Share | Cumulative | Class |
|---|---|---|---|---|---|---|---|
| 1 | Earbuds | 350 | 80 | 28,000 | 25.9% | 25.9% | A |
| 2 | Power bank | 400 | 60 | 24,000 | 22.2% | 48.2% | A |
| 3 | Phone case | 900 | 25 | 22,500 | 20.9% | 69.0% | A |
| 4 | Charger 20W | 300 | 35 | 10,500 | 9.7% | 78.8% | A |
| 5 | Charging cable | 1200 | 8 | 9,600 | 8.9% | 87.7% | B |
| 6 | Screen protector | 700 | 10 | 7,000 | 6.5% | 94.2% | B |
| 7 | Phone stand | 150 | 20 | 3,000 | 2.8% | 96.9% | C |
| 8 | Cleaning kit | 120 | 15 | 1,800 | 1.7% | 98.6% | C |
| 9 | Cable organiser | 80 | 12 | 960 | 0.9% | 99.5% | C |
| 10 | Lens clip | 30 | 18 | 540 | 0.5% | 100.0% | C |
Here, four of ten SKUs (A) bring in about 79% of value, two (B) add about 15%, and four (C) share the last 6%. Notice that the charging cable sells the most units (1,200) yet ranks only fifth by value. Consequently, the earbuds, with far fewer units, deserve the closest watch. In practice, that means counting earbuds and power banks more often, and ordering cleaning kits and lens clips less often in bigger batches.
Common ABC analysis mistakes
- Ranking by units instead of value. As the example shows, the busiest SKU is not always the most valuable.
- Using a distorted period. A single 11.11 or 12.12 spike can push a one-off item into class A. Use a longer window, or compare a normal period with a campaign period.
- Treating class C as waste. C items still need to be available when a customer needs them, so manage them lightly rather than ignoring them.
- Never refreshing. A list built once and filed away goes out of date within a few months.
- Mixing units of measure. If the same product is sold as a single piece, a box and a carton, convert to one unit before ranking.
How 8Stock helps with ABC analysis
8Stock is a cloud-based warehouse and inventory management system by Uniqbe Digital Sdn Bhd in Kuala Lumpur, built for Malaysian businesses. For ABC analysis, the useful parts are:
- Inventory Management: centralised stock across the whole company under one view, which improves visibility and demand planning.
- Report Management: daily, monthly, quarterly and yearly stock-take reports, date-selectable and exportable to Excel, so you can build your ranking in a spreadsheet.
- SKU management: multi-UOM and UPC support, which helps keep units consistent before you rank.
- Item-level tracking: serial, batch, quantity and barcode tracking, which supports the more frequent counts your A items need.
- Order Management: multi-channel sales orders (Shopee, Lazada, WooCommerce, nopCommerce) fulfilled against real-time inventory.
To be clear, you export 8Stock’s stock reports to Excel and do the ranking there. Together, these put your stock data in one system instead of several spreadsheets. To see how stock reports work, visit Report Management and Inventory Management. Then read our guide to the best warehouse management system in Malaysia, or explore 8Stock warehouse management solutions.
Request a Demo · WhatsApp +60 12 381 1376
Frequently asked questions
What is ABC analysis in inventory management?
ABC analysis ranks inventory SKUs by the value they contribute, usually units sold multiplied by price. A items are the few that bring most value, B items are in the middle, and C items are the many low-value ones. It helps you decide where to focus counting, restocking and cash.
How often should an SME update its ABC analysis?
Quarterly is a practical starting point for most SMEs. Re-run it after a major campaign such as 11.11 or 12.12, a price change or a big change in your product range, because SKUs move between classes. Use the same period length and method each time so results stay comparable.
Do I need a WMS to do ABC analysis?
No, a spreadsheet is enough to start. The difficulty is data quality, because stock, orders and units of measure often live in different places. A warehouse management system such as 8Stock keeps stock, orders and reports in one place, so the data you rank is easier to trust.
Can I use 8Stock reports for ABC analysis?
Yes, as a data source. 8Stock’s Report Management module provides daily, monthly, quarterly and yearly stock-take reports that are date-selectable and exportable to Excel. You then add sales value and rank the SKUs in your own spreadsheet. 8Stock does not automatically classify SKUs into A, B and C.
Ready to put your best-selling stock first?
Book a free 8Stock demo and see how stock, orders and reports work together for a Malaysian SME.